Normalization
To make indicators comparable and to facilitate analysis, the data are normalized by assigning the value 0 to the least desirable indicator values and the value 1 to the most desirable indicator values or targets, which are determined by experts, standards, laws, etc.
For example, HIV/AIDS prevalence rate per cent of population had a maximum value of 23.4% over all countries in 2011 (most recent data). Given its significant potential for rapid spread, even a value of 2% for this indicator is considered to be very bad. The Joint United Nations Programme on HIV/AIDS provides an upper bound of 0.9% on the average HIV prevalence rate (UNAIDS 2007). The least desirable value is chosen as twice the upper bound. All HIV/AIDS prevalence rates greater than or equal to 1.8% are assigned the value 0. The rate 0%, which is the target for this indicator, corresponds to 1.
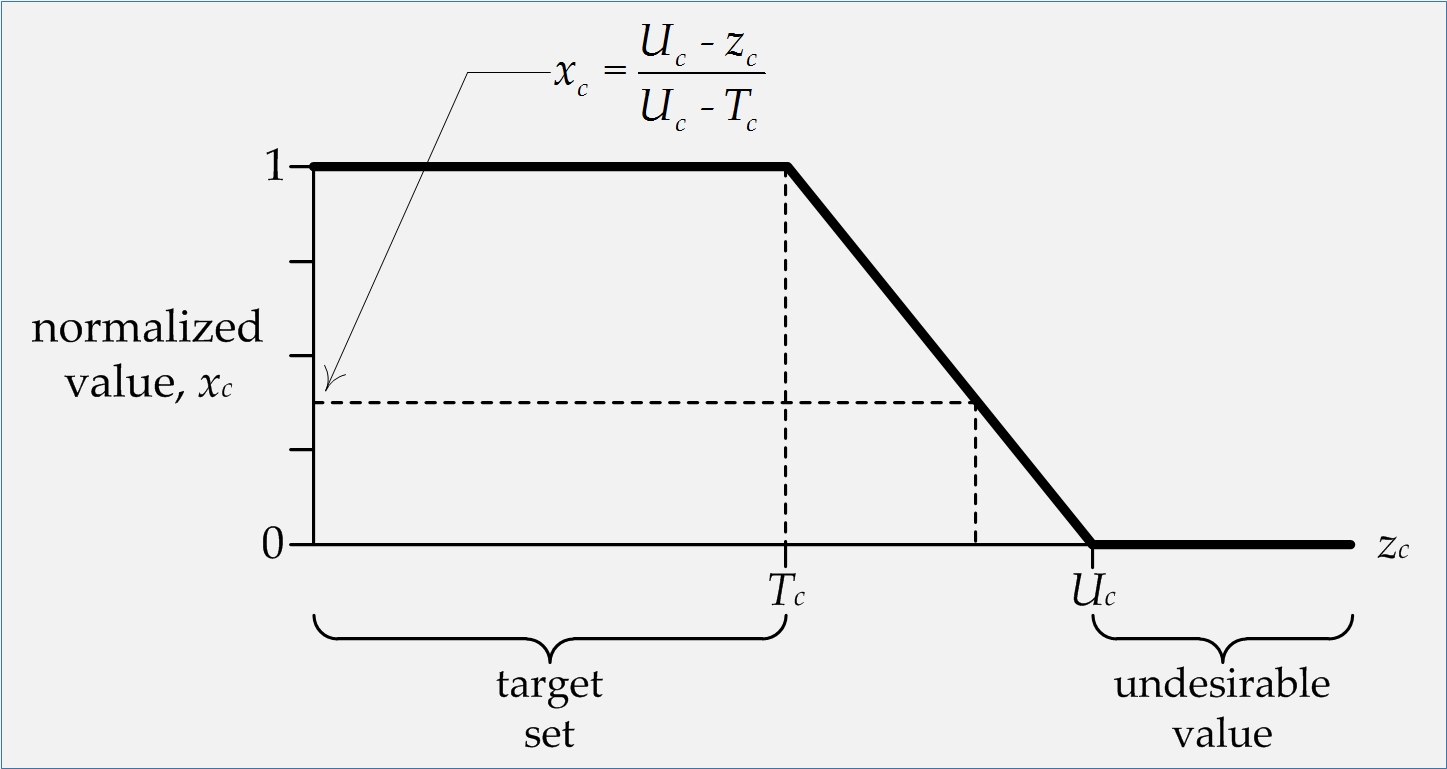
Let c be an indicator and zc its value for the country whose sustainability we want to assess. The target of c can be a single value Tc or an interval on the real line of the form [τc, Tc] representing a range of equally desirable values for the indicator. Least desirable values can be sole points or sets of values below or above some critical threshold. Critical values are denoted υc and Uc, so that all values zc ≤ υc or zc ≥ Uc are assigned a normalized value 0.
In practice υc is the minimum value of zc over all countries under examination and Uc its maximum. In some cases though we choose these numbers differently. For example, we have UAIDS = 1.8% whereas the maximum HIV/AIDS prevalence rate worldwide is 23.4%. Thus, if an indicator must be at most equal to Tc to be sustainable, then we have the case of Fig. 2. Here we do not need υc and τc. An HIV/AIDS prevalence rate of 0.9% is assigned the normalized value 0.5 because it is halfway between the target 0% and the critical threshold 1.8% of least desirable values.
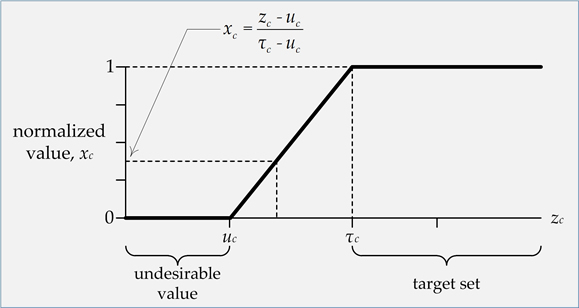
Similarly, if an indicator must be at least equal to τc to be sustainable, we have the case of Fig. 3 and we do not need Tc and Uc.
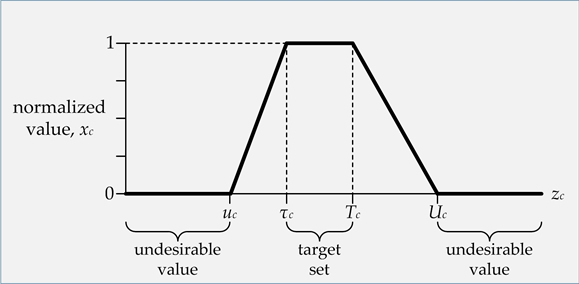
Finally, if an indicator must lie in [τc, Tc] to be sustainable, then we have the full diagram of Fig. 4.
A normalized value xc for zc is calculated as follows:
\[{x_c} = \left\{ {\begin{array}{*{20}{l}}0&{{z_c} \le {\upsilon _c}}\\{\frac{{{z_c} - {\upsilon _c}}}{{{\tau _c} - {\upsilon _c}}}}&{{\upsilon _c} < {z_c} < {\tau _c}}\\1&{{\tau _c} \le {z_c} \le {T_c}}\\{\frac{{{U_c} - {z_c}}}{{{U_c} - {T_c}}}}&{{T_c} < {z_c} < {U_c}}\\0&{{U_c} \le {z_c}}\end{array}} \right.\]The target and least desirable values for each indicator are given in the following table.
| Component | Basic Indicator | Typea | Thresholdsb,c |
|---|---|---|---|
| aSB = smaller is better; LB = larger is better; NB = nominal is best. | |||
| bυ, τ, T, and U are thresholds of target (sustainable) and unsustainable values. Values in the interval [τ, T] are assigned the sustainability index 1. Values ≤ υ or ≥ U indicate poor performance and are assigned the sustainability index 0. Values in (υ, τ) or (T, U) are scaled in (0, 1) by linear interpolation. | |||
cSources of indicator data:
|
|||
| PR(LAND) | Municipal waste (kg per capita per year) | SB | T = 300.0, U = 817.5 |
| PR(LAND) | Nuclear waste (tons per capita per year) | SB | T = 0, U = 0.0593 |
| PR(LAND) | Hazardous waste (tons per capita per year) | SB | T = 0, U = 1.0881 |
| PR(LAND) | Population growth rate (percent) | SB | T = 0, U = 1.2 |
| PR(LAND) | Pesticide consumption (kg per hectare) | SB | T = 3.22, U = 8.00 |
| PR(LAND) | Fertilizer consumption (kg per hectare) | SB | T = 162.471, U = 477.333 |
| ST(LAND) | Desertification of land (percent of dryland area) | SB | T = 0, U = 100 |
| ST(LAND) | Forest area (percent of what existed in 2000) | LB | υ = 0, τ = 100 |
| RE(LAND) | Forest change (annual rate) | LB | υ = -0.0690, τ = 0.0257 |
| RE(LAND) | Protected area (percent of total land area) | LB | υ = 0.2592, τ = 53.7527 |
| RE(LAND) | Glass recycling (percent of apparent consumption) | LB | υ = 0, τ = 100 |
| RE(LAND) | Paper recycling | LB | υ = 0, τ = 100 |
| PR(WATER) | Pesticide consumption (kg per hectare) | SB | T = 3.22, U = 8.00 |
| PR(WATER) | Fertilizer consumption (kg per hectare) | SB | T = 162.471, U = 477.333 |
| PR(WATER) | Water withdrawals (percent of internal resources) | SB | T = 22.7287, U = 90.8123 |
| ST(WATER) | BOD emissions (kg per capita per day)d1 | SB | T = 0.0090, U = 0.0146 |
| ST(WATER) | Phosphorous concentration (mg per liter of water) | SB | T = 0.1764, U = 0.6700 |
| ST(WATER) | Metals concentration (micro-Siemens per centimeter) | SB | T = 438.8, U = 2,247.4 |
| RE(WATER) | Public wastewater treatment plants (percent of population connected) | LB | υ = 0, τ = 86.64 |
| PR(BIOD) | Threatened mammals (percentage) | SB | T = 0, U = 35.46 |
| PR(BIOD) | Threatened birds (percentage) | SB | T = 0, U = 33.16 |
| PR(BIOD) | Threatened plants (percentage) | SB | T = 0, U = 8.45 |
| PR(BIOD) | Threatened fishes (percentage) | SB | T = 0, U = 55.10 |
| PR(BIOD) | Threatened amphibians (percentage) | SB | T = 0, U = 20.72 |
| PR(BIOD) | Threatened reptiles (percentage) | SB | T = 0, U = 20.75 |
| ST(BIOD) | Desertification of land (percent of dryland area) | SB | T = 0, U = 100 |
| ST(BIOD) | Forest area (percent of what existed in 2000) | LB | υ = 0, τ = 100 |
| RE(BIOD) | Forest change (annual rate) | LB | υ = -0.0690, τ = 0.0257 |
| RE(BIOD) | Protected area (percent of total land area) | LB | υ = 0.2592, τ = 53.7527 |
| PR(AIR) | Ozone depleting substances (metric tons per capita) | SB | T = 0, U = 0.1475 |
| PR(AIR) | Greenhouse gas emissions (tons of CO2 equivalent per capita) | SB | T = 0.0057, U = 0.0368 |
| ST(AIR) | Mortality from poor air quality (deaths per 100,000 population) | SB | T = 12.8, U = 1,805.2 |
| ST(AIR) | Urban NO2 concentration (mg/m3 of air) | SB | T = 18.20, U = 109.16 |
| ST(AIR) | Urban SO2 concentration (mg/m3 of air) | SB | T = 1.33, U = 97.07 |
| ST(AIR) | Urban TSP (total suspended particulates) concentration (mg/m3 of air) | SB | T = 18.92, U = 320.00 |
| RE(AIR) | Renewable energy production (percent of total primary energy supply) | LB | υ = 0, τ = 20 |
| PR(POLICY) | Military spending (percent of GDPd2) | SB | T = 1.5471, U = 8.4135 |
| PR(POLICY) | Refugees per capita (country of origin) | SB | T = 0.00025, U = 0.01000 |
| PR(POLICY) | Poverty (percent of population below national poverty line) | SB | T = 0, U = 29.6 |
| ST(POLICY) | Political rights (values in [1, 7])d3 | SB | T = 1, U = 3 |
| ST(POLICY) | Civil liberties (values in [1, 7])d3 | SB | T = 1, U = 3 |
| ST(POLICY) | Gini indexd4 | SB | T = 25.79, U = 50.00 |
| ST(POLICY) | Corruption Perceptions Index (values in [0, 10])d5 | LB | υ = 3, τ = 8 |
| RE(POLICY) | Environmental laws and enforcement (values in [0, 1])d6 | LB | υ = 0.1774, τ = 0.5974 |
| RE(POLICY) | Tax revenue (percent of GDP) | LB | υ = 9.4523, τ = 21.3757 |
| PR(WEALTH) | GDP implicit deflator (annual percent growth rate) | SB | T = 1.3221, U = 3.0871 |
| PR(WEALTH) | Imports (percent of GDP) | SB | T = 47.9642, U = 84.2983 |
| PR(WEALTH) | Unemployment (percent of total labor force) | NB | υ = 0.7, τ = 4.0, T = 7.0, U = 12.0 |
| PR(WEALTH) | Unemployment gender gap (percent) | SB | T = 0, U = 6.5 |
| ST(WEALTH) | Poverty (percent of population below national poverty line) | SB | T = 0, U = 29.6 |
| ST(WEALTH) | Central government debt (percent of GDP) | SB | T = 77.9, U = 176.2 |
| ST(WEALTH) | GNI per capita PPPd7 | LB | υ = 24,620, τ = 36,091 |
| RE(WEALTH) | Exports (percent of GDP) | LB | υ = 5.4856, τ = 50.3272 |
| RE(WEALTH) | Foreign direct investment (percent of GDP) | LB | υ = -2.8982, τ = 3.3123 |
| PR(HEALTH) | Mortality from poor air quality (deaths per 100,000 population) | SB | T = 12.8, U = 1,805.2 |
| PR(HEALTH) | Infant mortality rate (deaths per thousand) | SB | T = 2.63, U = 98.20 |
| PR(HEALTH) | Maternal mortality rate (deaths per 100,000 live births) | SB | T = 6.83, U = 690.00 |
| PR(HEALTH) | HIV/AIDS prevalence rate (percent of population aged 15-49) | SB | T = 0, U = 1.8 |
| PR(HEALTH) | Tuberculosis prevalence rate (per 100,000 population) | SB | T = 0, U = 993 |
| PR(HEALTH) | Malaria cases (per thousand people) | SB | T = 0, U = 0.0012 |
| ST(HEALTH) | Life expectancy (years) | LB | υ = 47.7764, τ = 80.9659 |
| ST(HEALTH) | Immunization against measles (percent of population) | LB | υ = 76, τ = 100 |
| ST(HEALTH) | Immunization against DPT (percent of population)d8 | LB | υ = 83, τ = 100 |
| ST(HEALTH) | Daily per capita calorie supply | LB | υ = 1,604, τ = 3,486 |
| RE(HEALTH) | Number of doctors (per thousand people) | LB | υ = 0.0080, τ = 3.7843 |
| RE(HEALTH) | Hospital beds (per thousand people) | LB | υ = 0.1000, τ = 3.1767 |
| RE(HEALTH) | Public health expenditure (percent of GDP) | LB | υ = 0.2589, τ = 8.2798 |
| RE(HEALTH) | Access to improved water sources (percent of population) | LB | υ = 40, τ = 100 |
| RE(HEALTH) | Access to improved sanitation (percent of population) | LB | υ = 9, τ = 100 |
| PR(KNOW) | Primary education ratio of students to teaching staff | SB | T = 12.8785, U = 76.0736 |
| PR(KNOW) | Secondary education ratio of students to teaching staff | SB | T = 10.9696, U = 66.8171 |
| PR(KNOW) | Tertiary education ratio of students to teaching staff | SB | T = 14.88, U = 45.50 |
| ST(KNOW) | Male expected years of schooling | LB | υ = 5.8829, τ = 12.0000 |
| ST(KNOW) | Female expected years of schooling | LB | υ = 4.0826, τ = 12.0000 |
| ST(KNOW) | Primary net school enrollment (percent of children) | LB | υ = 33.0700, τ = 98.2542 |
| ST(KNOW) | Secondary net school enrollment (percent of children) | LB | υ = 8.70, τ = 93.16 |
| ST(KNOW) | Literacy rate (percent of population) | LB | υ = 28.6724, τ = 100 |
| ST(KNOW) | Knowledge Economy Index (KEI; values in [0, 10])d9 | LB | υ = 4.07, τ = 8.61 |
| RE(KNOW) | Public expenditure on research and development (percent of GDP) | LB | υ = 0, τ = 2.2627 |
| RE(KNOW) | Public expenditure on education (percent of GDP) | LB | υ = 1.2291, τ = 5.8321 |
| RE(KNOW) | Personal computers (per thousand people) | LB | υ = 0, τ = 406 |
| RE(KNOW) | Internet users (per hundred people) | LB | υ = 0.26, τ = 78.11 |
| RE(KNOW) | Expenditure on information and communication (percent of GDP) | LB | υ = 0, τ = 5.6465 |