Overview of the SAFE model
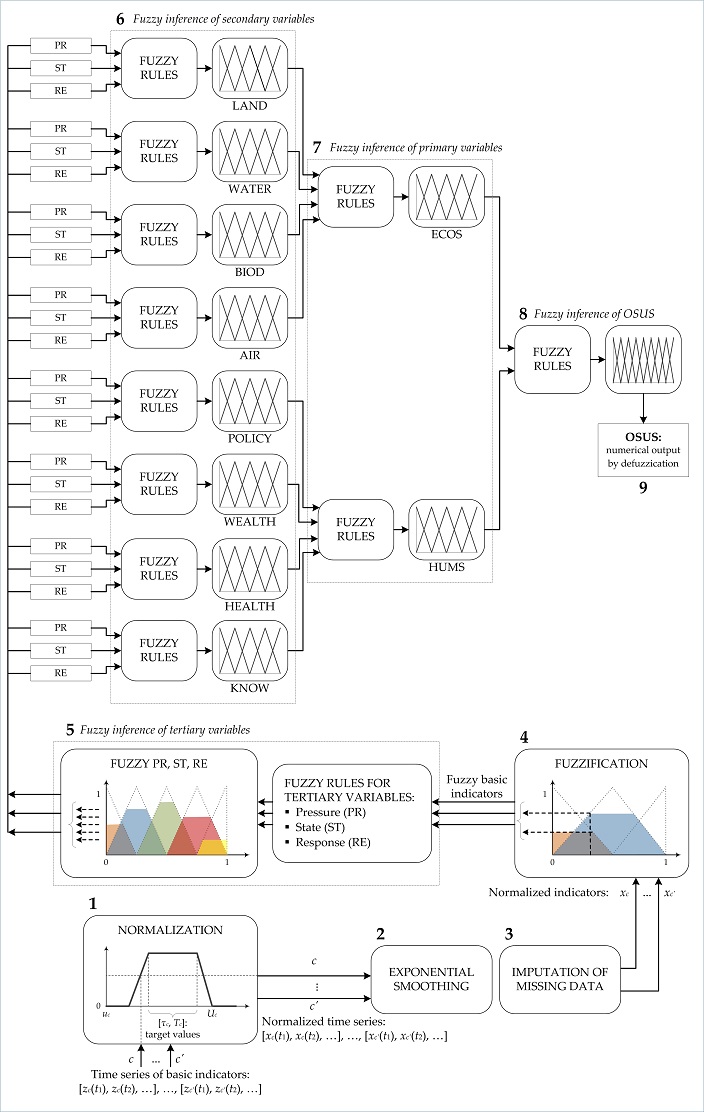
The structure of the SAFE model is shown in Fig. 1. The overall sustainability (OSUS) of a country is a combination of two primary components:
- ecological sustainability (ECOS), and
- societal or human sustainability (HUMS).
The ecological input comprises four secondary components:
- land integrity (LAND),
- water quality (WATER),
- air quality (AIR), and
- biodiversity (BIOD).
The components of the human dimension of sustainability are:
- political aspects (POLICY),
- economic welfare (WEALTH),
- health (HEALTH), and
- education (KNOW).
Each secondary component is assessed using the Pressure-State-Response approach of the Organization for Economic Cooperation and Development (OECD, 1991), which assumes that humans exert pressures on the environment which alter its conditions (state) and call for certain responses by the society.
In the SAFE model, tertiary indicators
- Pressure (PR),
- State (ST), and
- Response (RE)
are obtained by combining certain basic indicators. For example, the indicator PR(BIOD) measures the pressure on biodiversity using six basic indicators which give the percentage of all threatened (endangered, vulnerable) species: mammals, birds, plants, fishes, reptiles and amphibians.
The sequence of data processing is the following:
| 1 | Collection of available data and normalization in [0, 1]. | ||||
| 2 | Exponential smoothing. | ||||
| 3 | Imputation of missing data imputation. | ||||
| 4-8 | Fuzzy assessment of sustainability: | ||||
| fuzzification of basic indicators | |||||
| assessment of tertiary indicators (PR(LAND), ST(LAND), RE(LAND), ...) | |||||
| assessment of secondary indicators (LAND, ..., POLICY, ...) | |||||
| assessment of ecological and human components (HUMS, ECOS) | |||||
| overall sustainability (OSUS) | |||||
| 9 | Defuzzification of OSUS. | ||||
| 10 | Sensitivity analysis - decision making. | ||||
References
- Kouloumpis VD, Kouikoglou VS, Phillis YA (2008) Sustainability assessment of nations and related decision making using fuzzy logic, IEEE Systems Journal 2 (2), 224–236.
- OECD (1991) Environmental indicators: A preliminary set, OECD, Paris.